
Welcome to your regular compass through the dynamic landscape of the climbing industry. In each update, we distill global climbing stats, unraveling the trends, innovations, and economic currents shaping the indoor climbing industry.
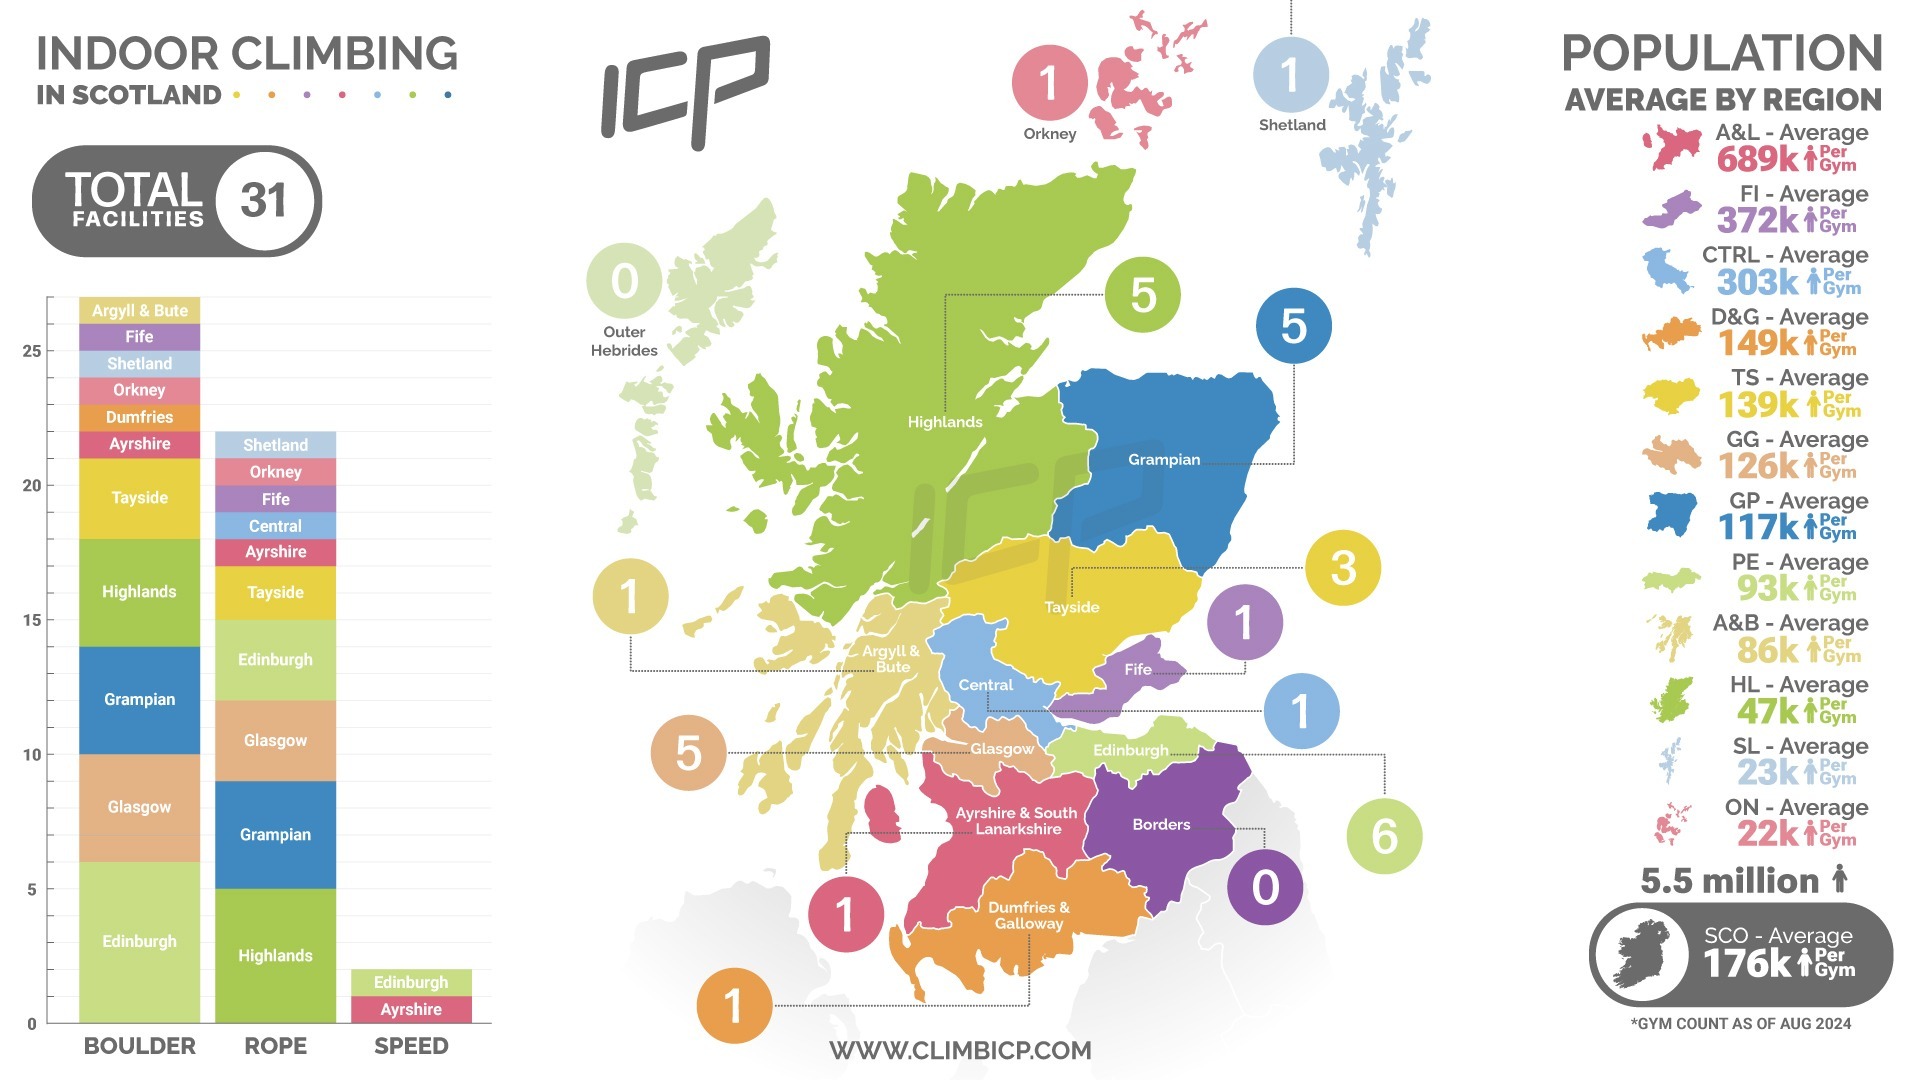
Scotland Statistics
Published: 5th of August, 2024
This month, we delved into Scotland’s population data and compared it with our August 2024 market research on climbing facilities across the country’s regions. Our analysis allowed us to map out gym distribution and evaluate the per-region population average against the number of climbing gyms. We also looked into the types of facilities available, including bouldering, top rope, and speed walls, to pinpoint the opportunity levels for new gyms in each area.
Interestingly, Scotland shows a strong interest in climbing, even in its smallest regions, when compared to countries with similar population sizes like Ireland, New Zealand, and Singapore. The regions just outside of Glasgow and Edinburgh, in particular, offer unique market opportunities due to high concentrations and interest in climbing. If you’re considering opening a climbing gym in Scotland, check out our infographic below to see how each region stacks up.
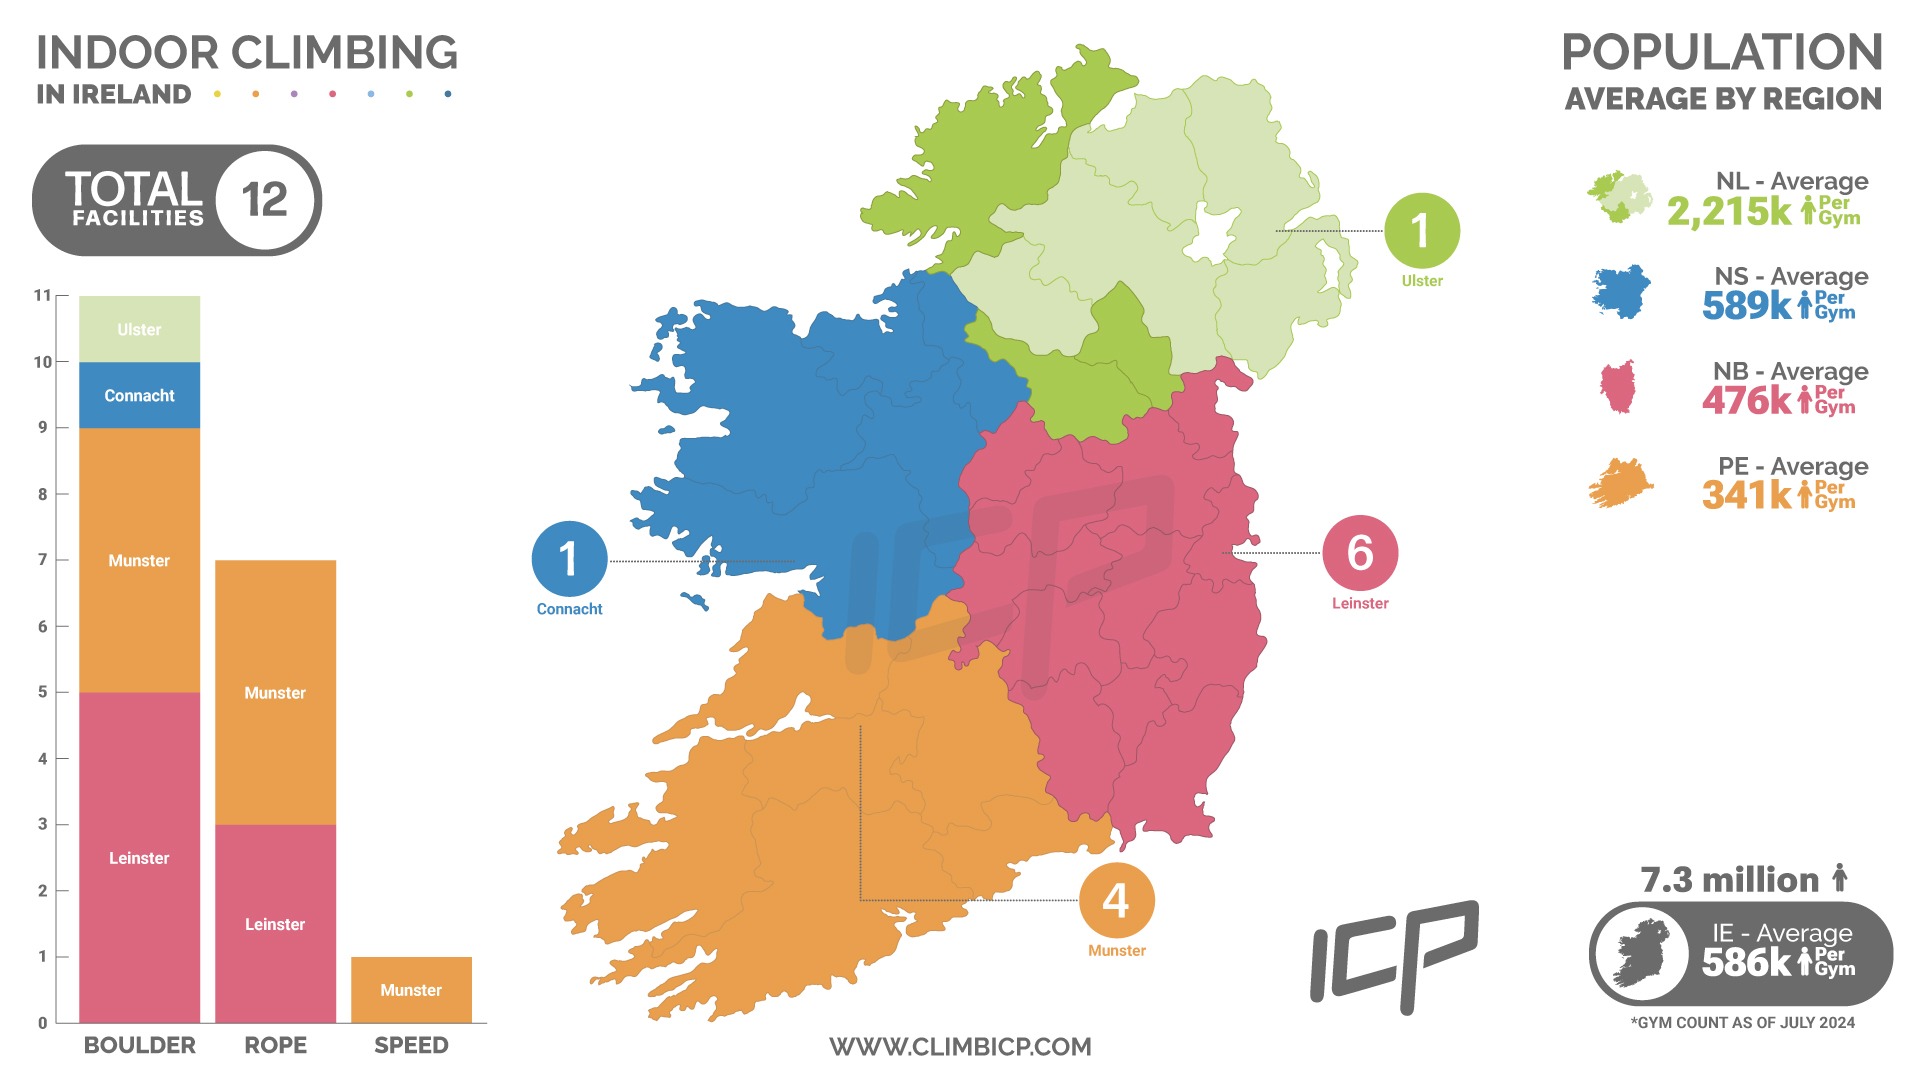
Ireland Statistics
Published: 8th of July, 2024
This month, we analysed Ireland’s population data and compared it with our market research data from July 2024 on climbing facilities across the four provinces. This analysis enabled us to determine the distribution of gyms and assess the per-region population average in relation to the number of climbing gyms. We also examined the facilities offered in terms of bouldering, top rope, and speed walls. Using these metrics, we identified the opportunity levels for gyms in each region.
Interestingly, compared to countries like New Zealand and Singapore, which have similar population levels but a much lower concentration of climbing gyms per person, Ireland presents a unique market opportunity. If you’re considering opening a climbing gym in Ireland, check out our infographic below to see how each region measures up:
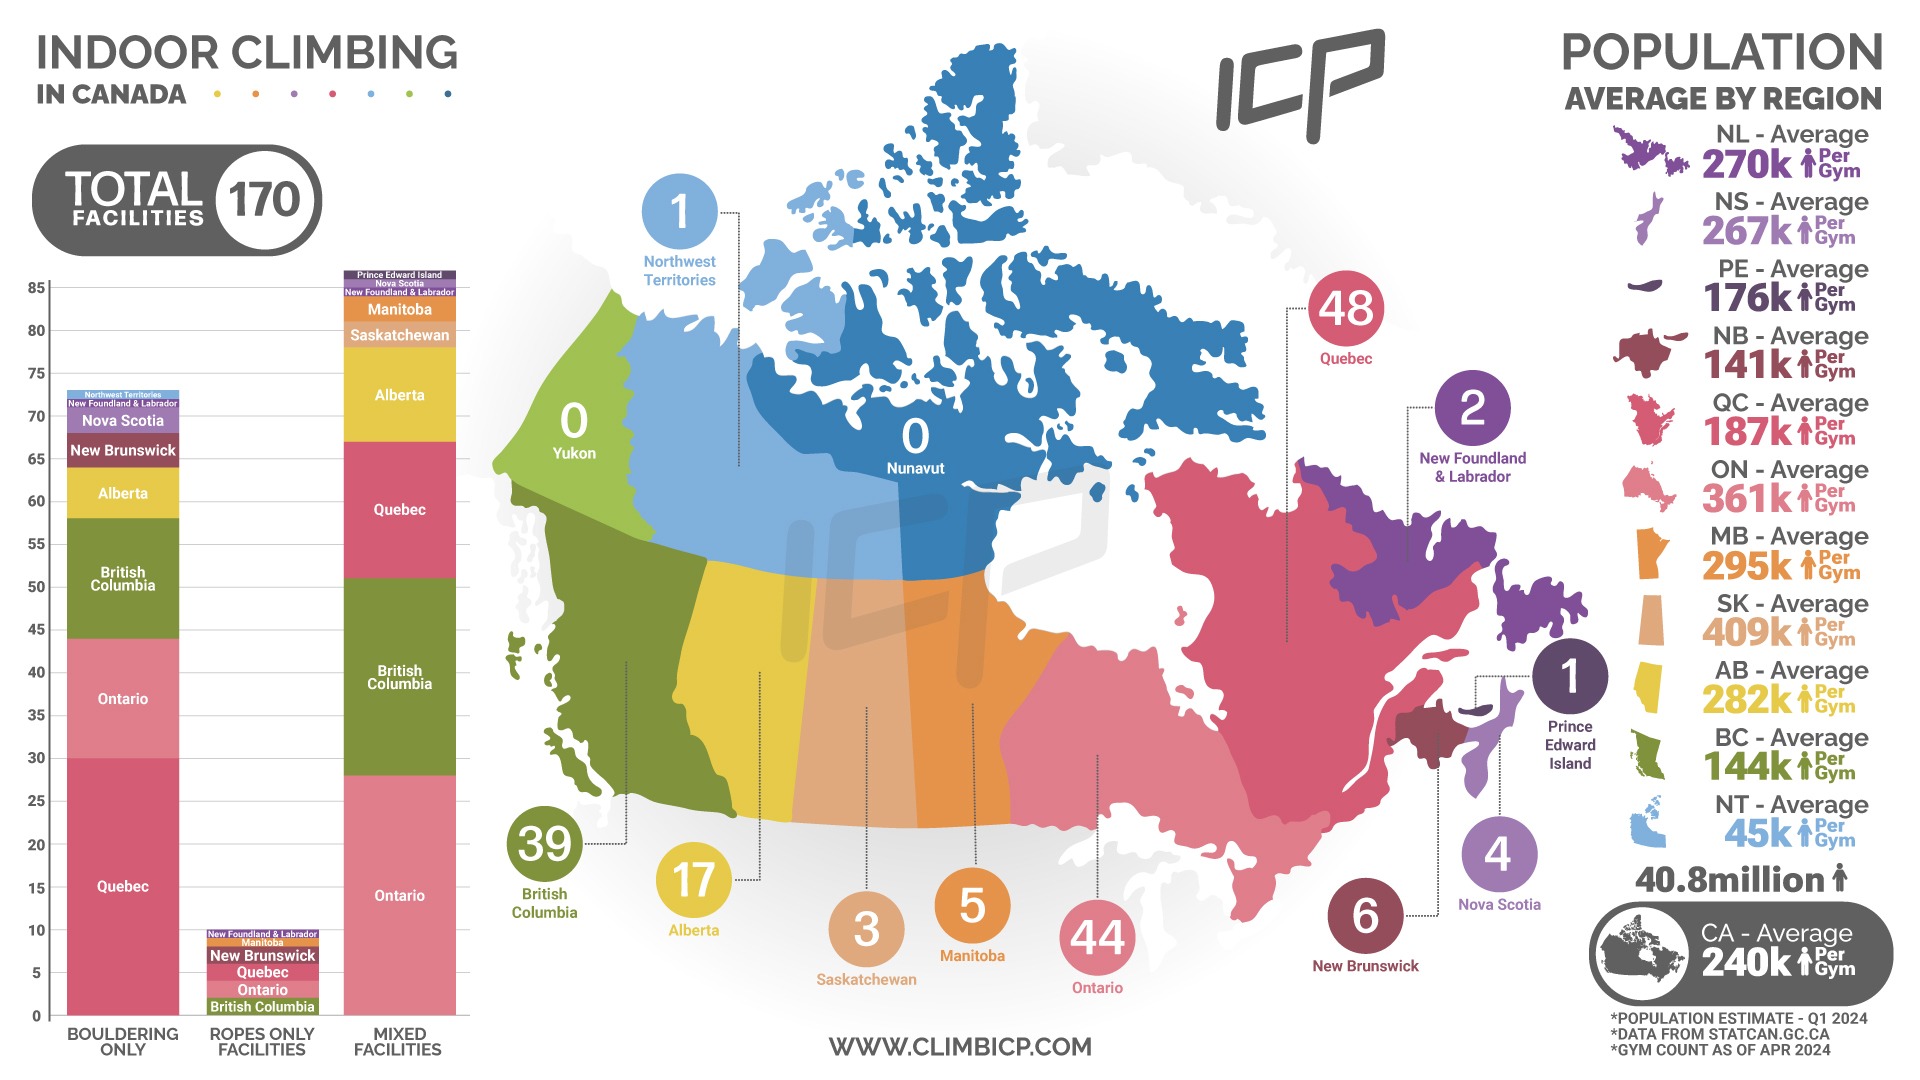
Canada Statistics
Published: 13th of May, 2024
We compared the Canada Statistics population estimates data from Q1 2024 and compared it with our market research data from April 2024 of climbing facilities across Canada. From this data, we’ve been able to work out the distribution of gyms and assess the per-region population average in relation to the number of gyms. We also compared what facilities are offering in terms of boulder, top rope, or both/mixed. Through these metrics, we can calculate the opportunity levels for gyms in each region. If you’re looking to build a climbing gym in Canada.. Check out our infographic below to see how each of the main regions stacks up:

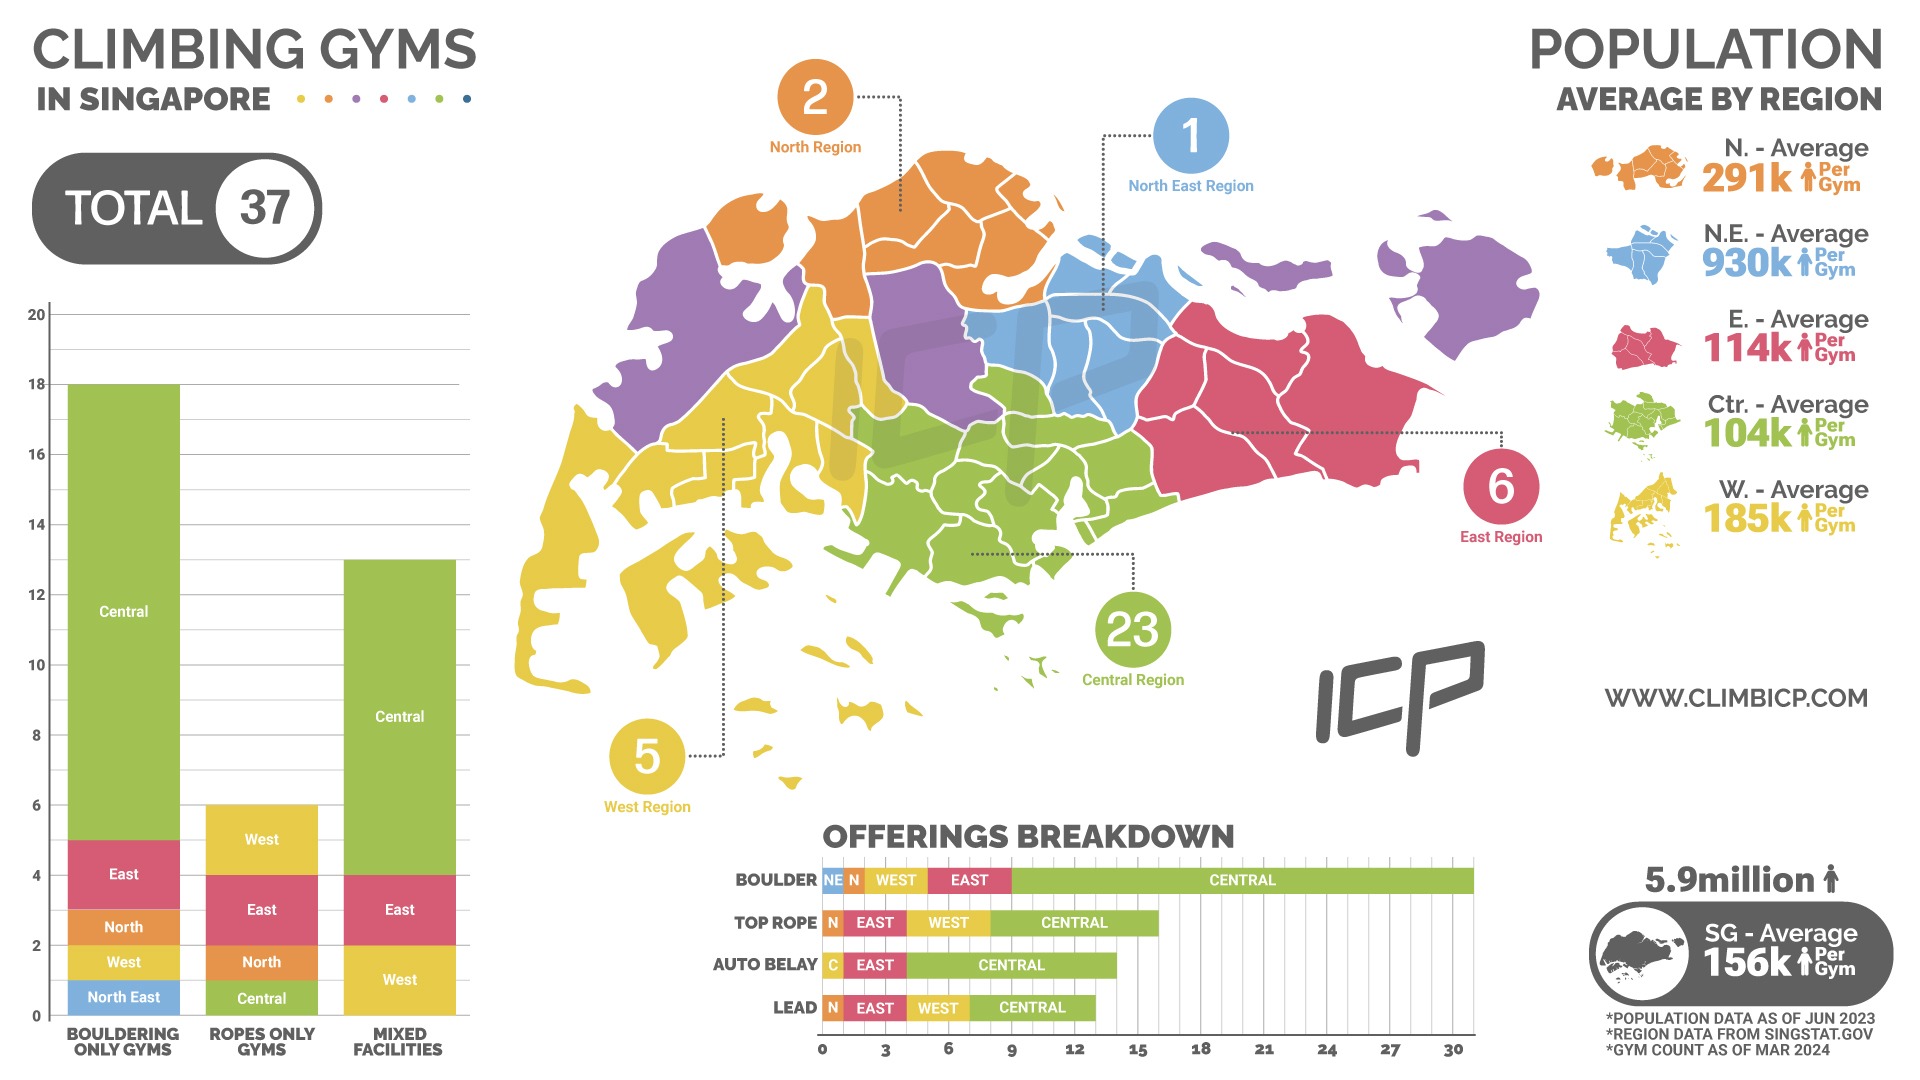
Singapore Statistics
Published: 2nd of April, 2024
We compared the Singapore Statistics population data from 2023 and compared it with our market research data from March 2024 of climbing gyms across Singapore. From this data, we’ve been able to work out the distribution of gyms across regions and assess the per-region population average in relation to the number of gyms. We also compared what facilities are offering in terms of boulder, top rope, lead and auto belays. Through these metrics, we can calculate the opportunity levels for gyms in each region. If you’re looking to build a climbing gym in Singapore, contact us for more in-depth info for each planning zone. Check out our infographic below to see how each of the main regions stacks up:
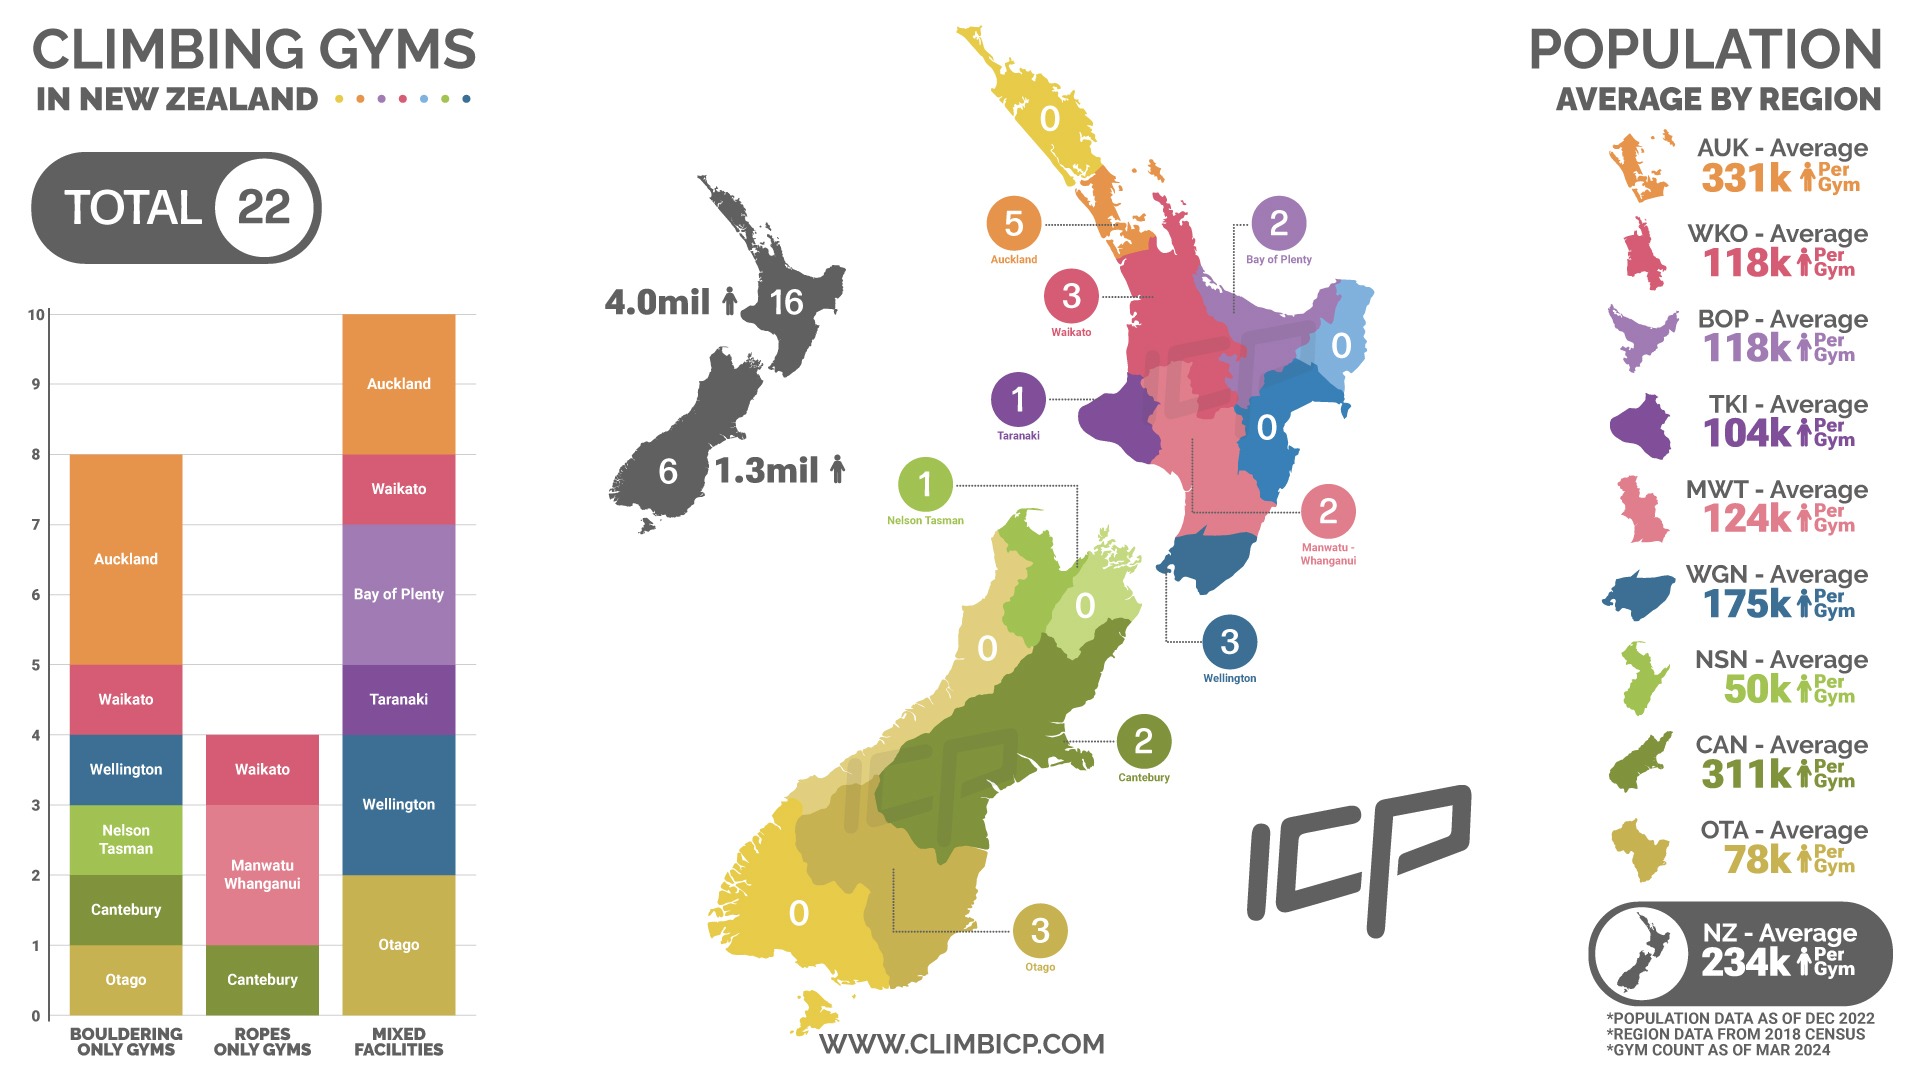
New Zealand Statistics
Published: 4th of March, 2024
We compared the Stats NZ census population data from 2018, along with their current population estimates and compared it with our market research data from March 2024 of climbing gyms across New Zealand. From this data, we’ve been able to work out the distribution of gyms across regions and assess the per-region population average in relation to the number of gyms. We also compared what facilities are offering in terms of boulder, rope climbing or mixed facilities. Through these metrics, we can calculate the opportunity levels for gyms in each region. Check out our infographic below to see how each region stacks up:
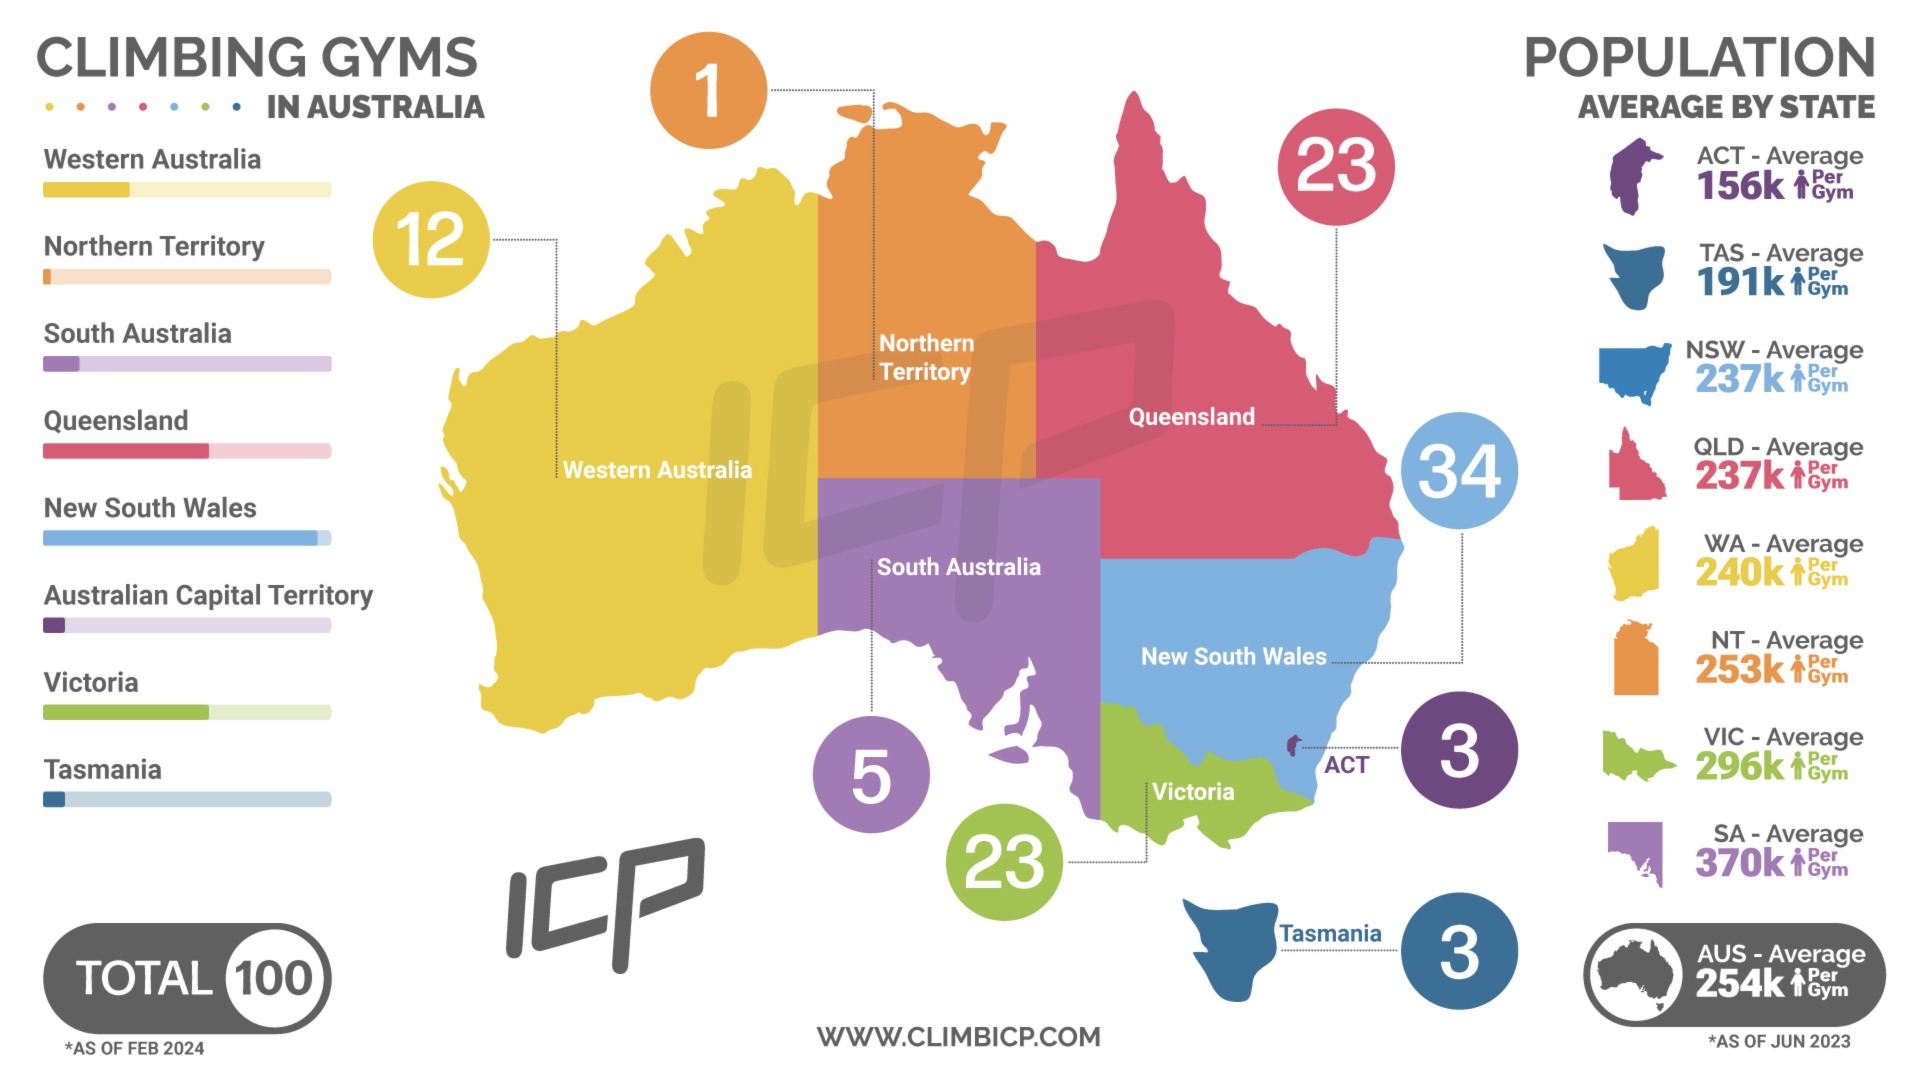
Australian Statistics
Published: 6th of February, 2024
We compared the Australian Burea of Statistics population data from June 2023 and compared it with our January, 2024 market research data of climbing gyms across Australia. From this data, we’ve been able to work out the distribution of gyms across states and assess the per-state population average in relation to the number of gyms. Through these metrics, we can calculate the opportunity levels for gyms in each state. Check out our infographic below to see how each state stacks up:


